Claude Dashboard Prompts: 10 Ready-to-Use Prompts (2026)
Dashboard prompts: 10 ready-to-use prompts for admin, sales and SaaS dashboards, Excel and CSV reports and Power BI; works in Claude, ChatGPT, Gemini and Entrobase Builder.
Prompt
Fill in the fields below and the prompt updates instantly. Copy it and use it in any AI tool.
Build a web-based admin dashboard for Kumsaati; a manager should see how the business is doing within 10 seconds of opening it and find a problem record in two clicks.
Dashboard typeecommerce sales dashboard (revenue, orders, average order value, returns).
Layoutclassic (left sidebar, metric cards on top, charts and table below).
Themelight (off-white background, white cards, thin borders).
Screens
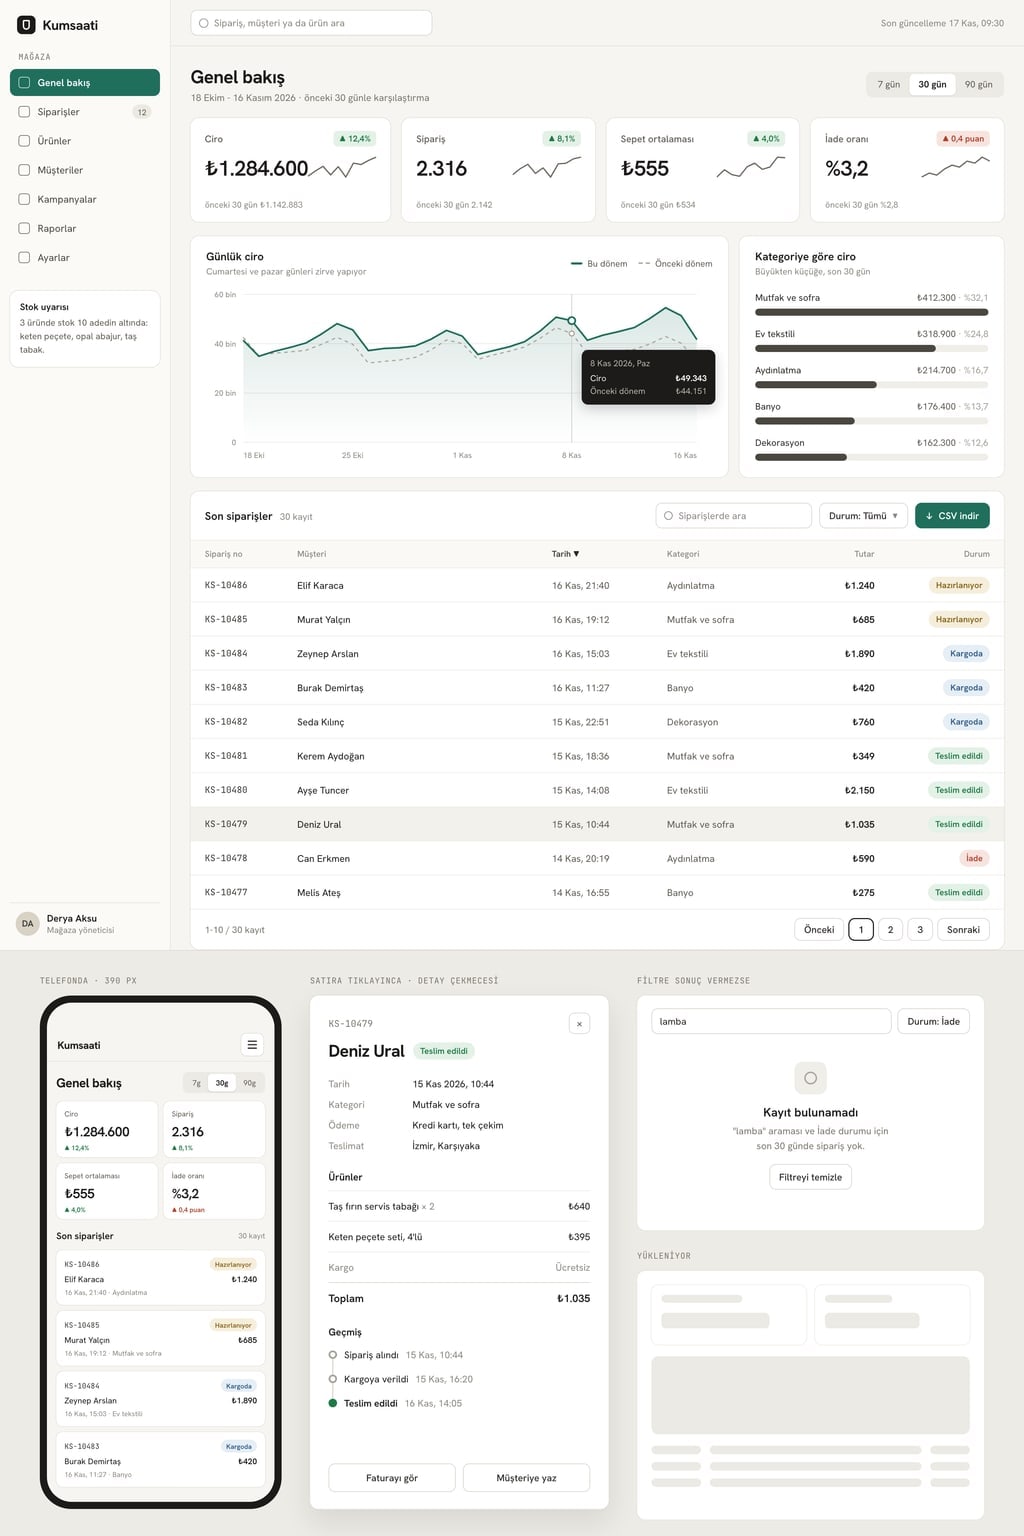
Overview: the 4 key metric cards of the dashboard type at the top; each card shows the value, the change versus the previous period (green when it improves, red when it worsens; for returns, churn, delays and costs an increase is red) and a small sparkline.
Main chart: the daily trend of the first metric in the selected period, with the previous period overlaid as a dashed line; hovering a point shows the date and value.
Breakdown: a horizontal bar chart by category or channel, sorted from largest to smallest.
Records table: the latest 30 records with search, a status filter, sorting by clicking a column header and 10 rows per page.
Detail panel: clicking a table row opens a drawer from the right with every field of the record and a short history.
Working parts
The period picker at the top (7 days, 30 days, 90 days) updates every card, chart and the table together.
All data comes from a single sample data file: 90 days of realistic, consistent numbers; card totals match the charts and the table.
The filtered table view can be downloaded as CSV.
Include a loading skeleton and an empty state; when a filter returns nothing, show "No records found" and a clear filters button.
On phones the sidebar or top tabs become a menu button, metric cards switch to 2 columns and the table turns into a scrollable card list.
Design
Accent color #1f6f5c; only on the selected menu item, the main chart line and the primary button.
A clean, characterful font for headings and a readable font with tabular numerals for figures.
Use bar and line charts for comparisons; no pie charts and no 3D charts.
Numbers right-aligned, one currency symbol with thousands separators throughout; equal spacing between cards.
Rules
Short, concrete English copy; no lorem ipsum.
Customer, product and person names are made up; no real brands or logos.
No login screen, no real database and no payments; data is read from the sample file.
Do not use purple-blue gradients, emoji icons or neon glow.
Design preview made from this prompt
9 more ready-to-use prompts
Different takes on the same topic. Copy any of them as is and replace the parts in square brackets.
1.Dashboard prompt for Claude: interactive React artifact
When to use: Use this when you want a working dashboard next to the Claude chat that you can refine by talking to it.
Write an interactive dashboard as a single-file React component and show it as an artifact.
- Topic
- [e.g. sales dashboard for an online store]
- Data
- [paste the first 20 rows of your CSV or list the columns; otherwise generate 90 days of realistic sample data]
Screen
- 14 metric cards at the top: value and change versus the previous period
- 2A daily line chart and a horizontal bar chart by category, built with Recharts
- 3A searchable, sortable records table
Working parts
- 7, 30 and 90 day buttons update every card and chart together
- Clicking a row opens a detail panel on the right
Design
- Tailwind classes, [light or dark] theme, accent color [hex code]
- Numbers right-aligned with thousands separators
Rules
- Card totals are calculated from the data, never hardcoded.
- When done, suggest 3 ways to improve the dashboard.
2.ChatGPT dashboard prompt: build it from an Excel or CSV file
When to use: Use this when you have a sales or records file and want ChatGPT to read the data and hand you a downloadable dashboard file.
Upload your Excel or CSV file first, then send this prompt.
Build a dashboard from the attached file.
Steps
- 1Summarize the columns, row count and date range in a table; list missing or invalid values
- 2Suggest 4 key metrics that fit this data and give the formula for each
- 3Draw a line chart for the daily or weekly trend and a bar chart for the breakdown
- 4Write the 3 most notable findings, one sentence each
Output
- Charts and findings in the chat
- At the end, a single HTML file that uses Chart.js with the data embedded; give me a download link
Rules
- Calculate every number from the file only; do not estimate.
- The file uses [currency]; format numbers with thousands separators.
3.Gemini Canvas dashboard prompt (single HTML file)
When to use: Use this when you want to see code and preview side by side in Gemini and edit parts of the dashboard by selecting them.
Open Canvas and write a dashboard that runs in a single HTML file.
- Topic
- [e.g. daily sales dashboard for a cafe]
- Data
- generate 30 days of realistic sample data and embed it in the file
Sections
- 14 metric cards: [metric 1], [metric 2], [metric 3], [metric 4]
- 2A daily line chart with Chart.js; the previous 30 days as a dashed line
- 3A horizontal bar chart by product, largest first
- 4A table of the latest 15 records with a status filter
Design
- [light gray or charcoal] background, accent color [hex code], tabular figures for numbers
- On phones, cards go to 2 columns and the table scrolls sideways
Rules
- No libraries other than Chart.js from a CDN.
- When done, point out which lines to edit to change colors and metric names.
4.Dashboard design prompt: layout plan and chart choices (no code)
When to use: Use this before any code to plan what goes where on the dashboard and which chart answers which question.
Act as a senior data visualization designer and write a design plan for a dashboard; do not write code.
- Dashboard
- [what it is for, e.g. operations dashboard for a delivery company]
- Users
- [who looks at it and how often]
- Questions it must answer
- [up to 5 questions]
Output
- 1For each question: metric, formula and the best chart type (why that chart, one sentence)
- 2Layout on a 12-column grid: how many columns each tile takes, top-to-bottom order
- 3Filters and the default period
- 4Color rules: where the accent color goes, how increases and decreases are shown
- 5What the empty, error and loading states say
Rules
- Suggest bar charts instead of pie charts.
- No more than 4 metric cards on the first screen.
5.Admin dashboard prompt for Next.js, Tailwind and shadcn/ui (GitHub-ready)
When to use: Use this when you want a component-based admin dashboard project that runs locally and is ready to push to GitHub.
Set up an admin dashboard project with Next.js (App Router), TypeScript, Tailwind CSS and shadcn/ui.
- Topic
- [e.g. revenue and user dashboard for a SaaS product]
Pages
- 1/: overview with 4 metric cards, a revenue line chart and a plan breakdown bar chart
- 2/customers: searchable, paginated table; clicking a row opens a detail drawer
- 3/settings: profile and notification preferences form (UI only)
Structure
- Separate KpiCard, LineChartCard, DataTable and Sidebar files under components/
- 90 days of sample data and calculation helpers in lib/data.ts
- A light and dark theme toggle
Output
- 1Folder tree
- 2Full code for every file
- 3Install and run commands
- 4A short README
6.Dashboard requirements example: a prompt that writes the spec
When to use: Use this before building, when you need a document for your team or developer that defines the metrics and data sources.
Write a dashboard requirements document from the details below.
- Business
- [company and industry]
- Goal of the dashboard
- [which decision it should make easier]
- Users
- [roles and how many people]
- Data sources
- [e.g. ecommerce platform, accounting sheet, ad account]
Sections
- 1Goal and success criteria
- 2User roles and the screens each role sees
- 3Metrics table: name, formula, data source, refresh frequency
- 4Filters, period selection and export
- 5Access and privacy rules
- 6Out of scope
Rules
- End with a list of questions for anything left unclear.
- Use metric names consistently; never give one thing two names.
7.Power BI dashboard prompt: report pages and DAX measures
When to use: Use this when the dashboard lives in Power BI and you want a page plan and ready DAX measures from ChatGPT, Claude or Copilot.
Prepare a page plan and DAX measures for a Power BI report.
- Tables and columns
- [e.g. Sales(Date, ProductID, Qty, Amount), Products(ProductID, Category)]
- Relationships
- [e.g. Sales[ProductID] → Products[ProductID]]
- Questions
- [3-5 questions the report must answer]
Output
- 1For each report page: title, visuals (visual type, axes, fields) and slicers
- 2DAX measures: total sales, change versus the previous period, average order value and any others each question needs; code plus a one-sentence explanation for each
- 3DAX code for a date table if one is needed
- 4Suggestions for page navigation and drill-through
Rules
- Keep measure names consistent.
- Prefer measures over calculated columns unless a column is truly needed.
8.Monitoring dashboard prompt: uptime, errors and latency
When to use: Use this when you want to watch servers, an API or a website on one screen: status, error rate and response time.
Write a system monitoring dashboard.
- What it monitors
- [e.g. 6 servers and 3 API services]
Sections
- 1Status strip: a green, amber or red badge and last check time for each service
- 2Metric cards: uptime percentage, requests per minute, error rate, p95 response time
- 3A line chart of response time over the last 24 hours, with the threshold as a dashed horizontal line
- 4Open alerts list: severity, service, start time, duration
Working parts
- Data refreshes every 10 seconds from sample data, with a pause button
- Clicking an alert brings that service's chart to the front
Design
- Dark theme, tabular figures, color used only for status
- Output
- [a single HTML file or React and Tailwind] code.
9.Dashboard UI review from a screenshot
When to use: Use this when you already have a dashboard and want ChatGPT, Claude or Gemini to check its readability and chart choices from a screenshot.
Upload a screenshot of your dashboard first, then send this prompt.
The attached image is a dashboard. Review it like a data visualization expert.
- Who uses it
- [role]
- Key decision
- [which decision the dashboard supports]
Check
- 1Is the most important number visible within the first 10 seconds?
- 2Do the chart types fit the questions; any misleading choices like pie, 3D or dual-axis charts?
- 3Is color used with meaning or just as decoration?
- 4Are alignment, spacing and number formats consistent?
Output
- The 5 most important issues in priority order, one sentence each, with the fix
- A short text outline of the suggested new layout
What this prompt does
People searching for dashboard prompts want copy-paste text that makes Claude, ChatGPT or Gemini build a working admin dashboard with metric cards, charts, filters and a table. The main prompt lets you pick the dashboard type, layout and theme, and its period picker updates every card and chart together. The 9 prompts below cover a Claude artifact, ChatGPT with Excel data, Gemini Canvas, a no-code design plan, a Next.js repo, a requirements doc, Power BI, monitoring and a screenshot review.
Where to use it
- Ecommerce sales dashboard
- SaaS revenue and user dashboard
- Restaurant daily report
- Shipping and delivery tracking
- Marketing campaign report
- Inventory and warehouse management
Fields you can fill in
The fields you can change in the form above and their default values.
- Company nameFree text
- Kumsaati
- Dashboard typeOne of 6 options
- ecommerce sales dashboard (revenue, orders, average order value, returns)
- LayoutOne of 4 options
- classic (left sidebar, metric cards on top, charts and table below)
- ThemeOne of 3 options
- light (off-white background, white cards, thin borders)
- Accent colorColor
- #1f6f5c
Step by step
- 1
Pick the dashboard type and layout
Type your company name and choose your business from the Dashboard type list; it also sets the four key metrics, such as revenue, orders, average order value and returns for ecommerce. Then choose a classic, bento, top-tab or data-dense layout.
- 2
Set the theme and accent color
The theme sets the background and card style. The accent color only appears on the selected menu item, the main chart line and the primary button, so up and down colors stay separate. The prompt updates as you choose; read the final text before copying.
- 3
Paste it into your tool
Copy it. In Claude, paste it into the chat and the dashboard opens as an artifact next to it; in Gemini, choose Canvas and paste; in ChatGPT, ask for a single HTML file. In Entrobase, the Start button sends it to Builder, which sets it up as a Next.js project.
- 4
Check consistency with the period picker
Switch between 7, 30 and 90 days: card totals should match the main chart and the table. If they don't, write "calculate the card totals from the sample data file" in the same chat.
- 5
Swap the sample data for yours
The first version uses made-up data. Paste the first 20 rows of your own sales or records file with column names into the same chat and ask it to rewrite the sample data file in that shape; remove personal customer details before sharing.
Tips and variations
- Use bar and line charts for comparisons: Nielsen Norman Group notes that length and 2D position communicate quantities fastest, and that pie charts and tree maps are generally not recommended for quick comparisons.
- Use color to group things, not to show magnitude; NN/g says color should not communicate quantitative values. That is why the main prompt limits the accent color to three places.
- Put at most 4 metrics on the first screen and show the change versus the previous period next to each; a number without a comparison doesn't tell you whether it is good or bad.
- Pick the data-dense layout for teams who work in the dashboard every day and the roomy classic layout for managers who check it weekly; bento reads best in presentations and screen shares.
- Approve the dashboard with sample data before connecting real data; if the sample file uses the same column names as your own file, the switch takes one step.
Frequently asked questions
What should a dashboard prompt include?
Who uses the dashboard, the 3-5 questions it must answer, the key metrics with their formulas, the chart for each question, filters and default period, and where the data comes from. The main prompt on this page also asks for loading and empty states and a mobile layout.
How do I make a dashboard with ChatGPT?
Upload your Excel or CSV file to ChatGPT, then paste the ChatGPT prompt from this page. It has ChatGPT summarize the columns, suggest 4 key metrics, draw the charts and finally deliver a single downloadable HTML dashboard file.
How do I use a dashboard prompt for Claude?
Paste the prompt into a Claude chat; the dashboard opens as a React artifact next to the conversation and you can click through it right away. Ask for changes in the same chat, such as "add a date filter to the table", and Claude updates the artifact.
Can Gemini build a dashboard?
Yes. Choose Canvas in Gemini and paste the prompt; code and preview open side by side. According to Google's help page, Canvas lets you view the code, check error logs and console output, and select part of an app to have Gemini edit it.
Do dashboard prompts work with Copilot in Power BI?
Yes, with conditions: Microsoft says Copilot needs a paid Fabric (F2 or higher) or Power BI Premium (P1 or higher) capacity, accepts prompts up to 10,000 characters, and languages other than English aren't officially supported.