Data Visualization Prompts: 8 Ready-to-Use Prompts (2026)
8 data visualization prompts: statistics infographics, charts from a table, interactive dashboards, survey results and comparison visuals; works in ChatGPT, Gemini, Claude and Entrobase Canvas.
Tested: EntroGen Flash, November 2026
Prompt
Fill in the fields below and the prompt updates instantly. Copy it and use it in any AI tool.
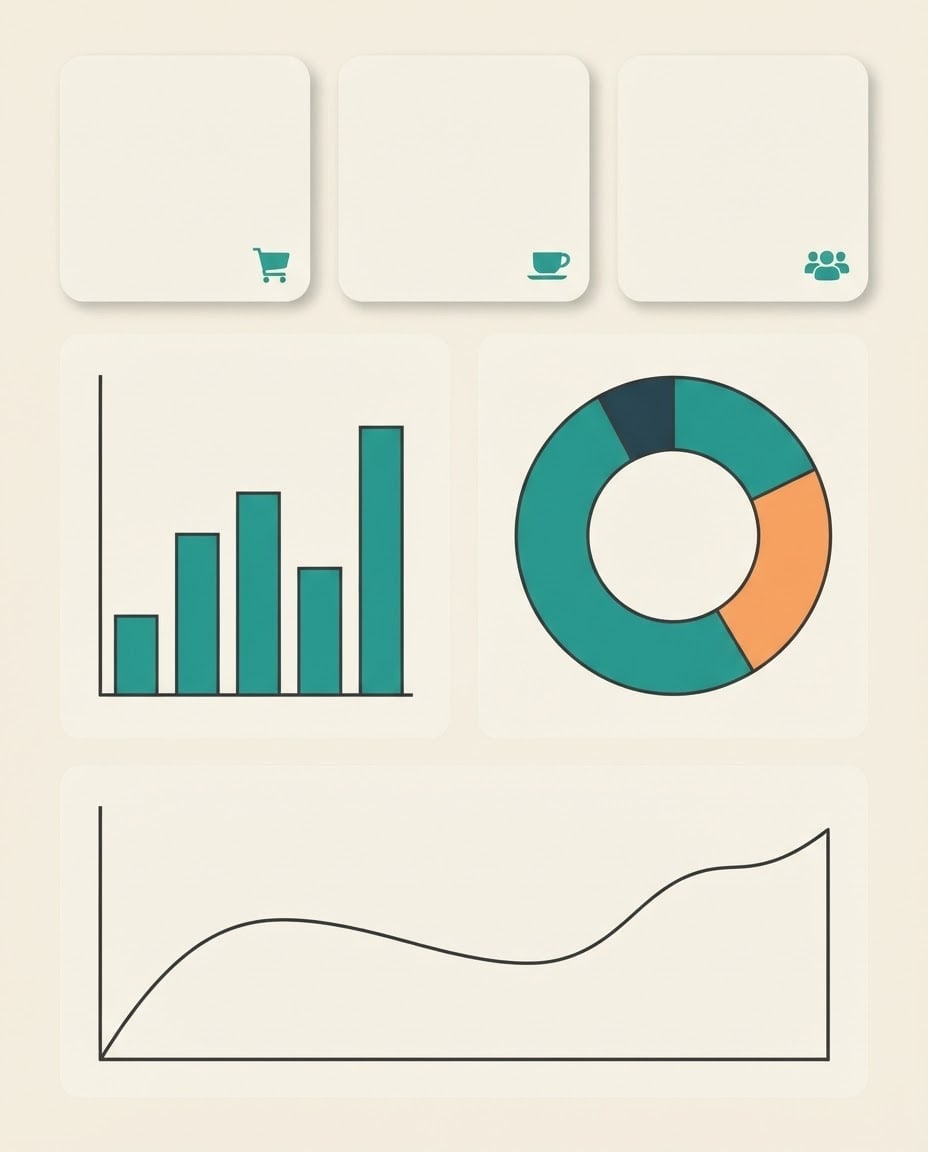
Create a statistics infographic poster with the numbers to be added later.
Topica cafe's monthly sales and customer statistics; the topic is shown only through the small icons in the card corners.
Contenta vertical bar chart on the left, a donut chart on the right, a smooth line chart at the bottom; at the top, three empty rounded number cards side by side, each with a small icon in the corner.
Styleclean, flat-color modern infographic.
Backgroundplain light cream; equal space between the panels.
Lightflat and even, a very light shadow under the cards.
Palettemain color #2a9d8f, two supporting tones and dark charcoal lines.
Compositiona tidy grid; the number cards start at the top, with only plain background and a narrow margin above them.
Textthe image is completely text-free; no title, numbers, percent signs or axis labels; the cards are empty.
Aspect ratio 4:5.
Image made with this prompt
7 more ready-to-use prompts
Different takes on the same topic. Copy any of them as is and replace the parts in square brackets.
1.Data visualization prompt for ChatGPT: chart from your table
When to use: When you have data and every value in the chart has to be right.
Draw a chart from the data below.
- Data
- [paste your table or CSV here].
- Chart
- [e.g. sales by month, bar chart]; the highest month in an accent color.
- Audience
- [e.g. the cafe owner and team].
Output
- 1The chart image with axis names and a title.
- 2The two most important findings, one sentence each.
Rules
- Do not add values that are not in the data.
2.Gemini data visualization prompt: stat card with a short label
When to use: When you want one striking number as a shareable card with the number written in.
Create a statistics card image.
- Main number
- large, centered "[e.g. 68%]" (exactly this text).
- Chart
- a donut chart around the number showing the same share.
- Style
- flat-color modern infographic with generous space.
- Palette
- [e.g. teal and cream].
Rules
- No text in the image other than this number.
- Ratio
- 4:5
3.Data visualization AI prompt for Claude: interactive dashboard
When to use: When you want your data as a browser dashboard that shows values on hover.
Write a single-file interactive HTML dashboard from the data below.
- Data
- [paste your CSV here].
Dashboard
- 3 summary cards at the top (total, average, highest).
- A line chart and a bar chart below; values appear on hover.
- Design
- light theme with one accent color [e.g. teal].
Rules
- Do not add values that are not in the data.
4.Survey results infographic prompt
When to use: When you want to share the results of a customer or employee survey visually.
Create a survey results infographic with the numbers added later.
- Content
- 4 question panels; each with a horizontal bar chart and a small icon (e.g. satisfaction, speed, price, recommendation).
- Style
- clean flat-color infographic.
- Palette
- [e.g. navy, light blue and a yellow accent].
- Text
- no text or numbers in the image; an empty label area beside each bar.
- Ratio
- 4:5
5.Comparison infographic prompt: two products or two periods
When to use: When you want a visual that compares two things side by side.
Create an infographic comparing two sides.
- Layout
- split down the middle; the left side [e.g. last year], the right side [e.g. this year].
- Content
- 3 rows per side; each row with an icon and two facing horizontal bars.
- Palette
- left [e.g. coral], right [e.g. teal].
- Text
- no text or numbers in the image; an empty label area at the end of each bar.
- Ratio
- 16:9
6.Data slide background for presentations
When to use: When your deck needs a polished data slide background to place your own chart on.
Create a data slide background for a presentation.
- Content
- a soft 3D bar chart with a rising arrow in the lower right.
- Composition
- the left half and the top a plain continuation of the background, open for a title and text.
- Style
- soft 3D with pastel surfaces.
- Palette
- [e.g. lilac and white].
- Text
- no text or numbers in the image.
- Ratio
- 16:9
7.Data visualization prompts: which chart should I use?
When to use: When you do not know which chart type fits your data.
Choose the best chart type for the data below and explain why.
- Data
- [paste your table or CSV here].
- Goal
- [e.g. show which product grew the most].
Output
- 1The recommended chart type with a one-sentence reason.
- 2Axes, colors and the value to highlight.
- 3A chart type to avoid and why.
What this prompt does
There are two ways to turn data into a shareable visual: use the ChatGPT, Gemini or Claude variants for charts with your real numbers, or the main prompt for a polished template image for reports and social media. The main prompt makes a statistics poster with bar, donut and line charts and empty number cards; you type the numbers in later.
Where to use it
- Monthly report cover
- Social media stat card
- Presentation slide
- Survey results post
- Investor and team summary
Fields you can fill in
The fields you can change in the form above and their default values.
- TopicFree text
- a cafe's monthly sales and customer statistics
- StyleOne of 4 options
- clean, flat-color modern infographic
- BackgroundOne of 3 options
- light cream
- Main colorColor
- #2a9d8f
- RatioOne of 3 options
- 4:5
Step by step
- 1
Decide which route you need
If the bars must show your real values, have ChatGPT or Claude draw the chart from your data with the variants. If a visual template is enough, use the main prompt; its bar heights are illustrative.
- 2
Pick the topic and style
Put what the data is about in the Topic field (for example a cafe's monthly sales); icons and chart mood follow it. The dark dashboard style suits tech reports, the paper-cut style suits educational content.
- 3
Generate in Canvas and check the empty areas
Generate in Canvas with Use Prompt and check that the three number cards are empty and the charts have no axis text. If fake digits appear, generate again with the same prompt.
- 4
Add the numbers and title
Open the image in a design tool, type your three key numbers in the cards and add the title above the cards or outside the image. Typing real numbers afterwards keeps every value matched to your source.
Tips and variations
- The most-read stat card on social media is one big number with a donut chart; the percentage card variant gives you that.
- For a report series, keep the main color and style fixed and change only the Topic field so the pages look like one family.
- In comparisons, give the two sides opposite colors (for example teal and coral); readers see the difference in color before the numbers.
- When working with real data, share its source and ask for a source line under the chart.
Frequently asked questions
How do I visualize data with ChatGPT?
Paste your data as a table or CSV and say which chart you want, the axes and the title. ChatGPT draws the chart with code through its data analysis feature, so the numbers match your data.
How do I write a data visualization prompt?
A good prompt states the data, the audience (for example management or students), the chart type, the finding to highlight and the output format (image, code, dashboard). If you are unsure of the chart type, ask it to choose based on the data.
Can an image model draw a chart with real numbers?
Image models draw a chart's look; bar heights and digits do not always match your data. For work that needs exact values, use the ChatGPT or Claude variants that draw with code.
Can Claude make an interactive chart?
Yes, Claude can write an interactive HTML and JavaScript dashboard from your data, and the variants include a ready prompt for it. Open the result in a browser and hover to see values.
What ratio should a statistics infographic use?
4:5 suits Instagram and report pages, 16:9 suits slides. Google's model page lists both among the ratios Gemini 3.1 Flash Image supports.