ChatGPT Gantt Chart Prompts: 8 Ready-to-Use Prompts (2026)
8 Gantt chart prompts: a project schedule image, a ChatGPT task table, Gantt data for Excel, Mermaid code and a Claude plan with dependencies; Entrobase Canvas makes the image.
Tested: EntroGen Flash, November 2026
Prompt
Fill in the fields below and the prompt updates instantly. Copy it and use it in any AI tool.
Create a Gantt chart (project schedule) infographic with text to be added later.
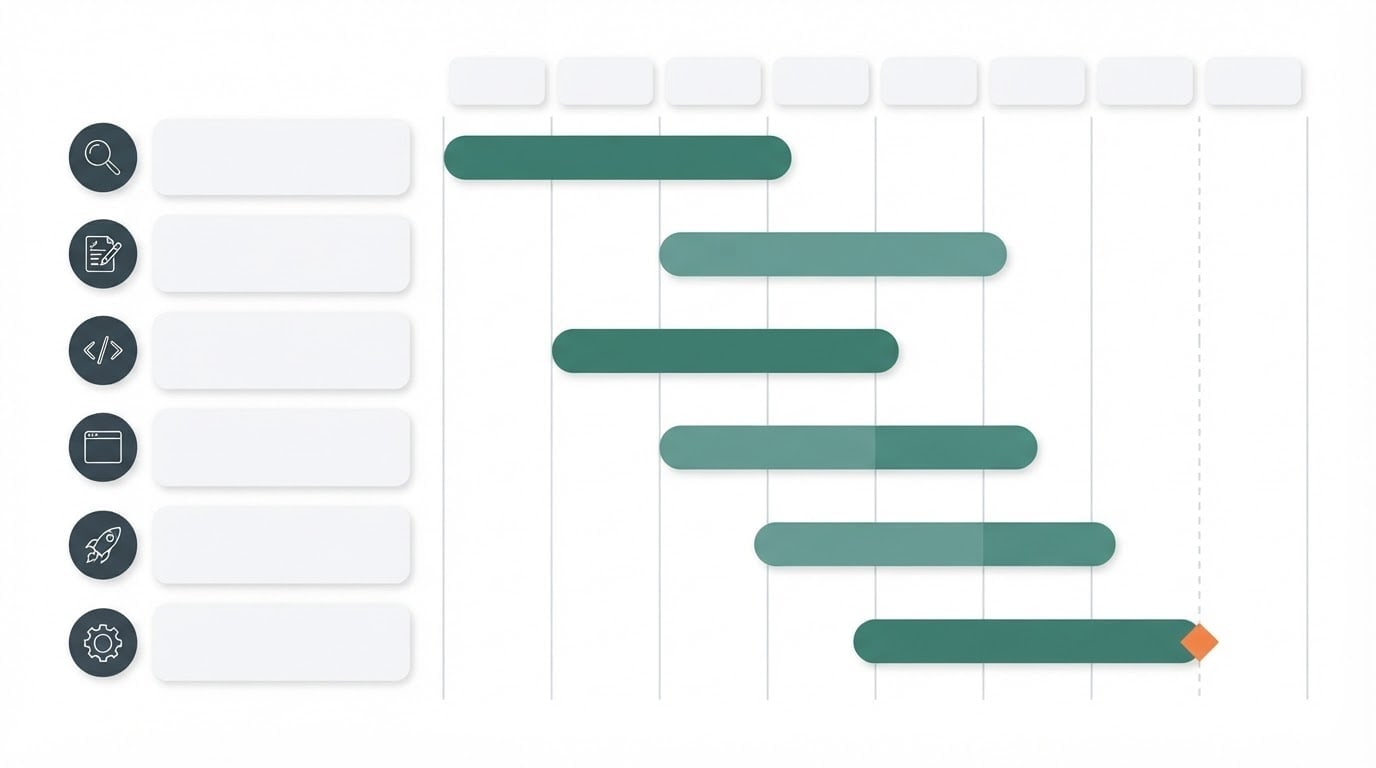
Layouton the left, a vertical column of 6 rows, each with a small round icon badge (top to bottom: magnifier, sketch sheet, code brackets, browser window, rocket, gear) and an empty, plain white, rounded card beside it. On the right, a schedule grid split into 8 equal columns by thin vertical lines, with 8 small empty header cards above it.
Barsevery row has one horizontal bar with rounded ends; the bars step to the right from top to bottom like a staircase and some overlap. A small diamond milestone at the end of the last row and a thin dashed line cutting vertically through the grid.
Styleflat-color modern vector infographic.
Backgroundflat white with light gray grid lines.
Lightflat and even, very light shadows.
Palettebars in shades of #3a7d6b, dark charcoal icons and one orange accent.
Compositionthe chart fills the whole image, rows evenly spaced, margins at the edges.
Textthe image has no text at all; every card is empty, with no words, letters, dates or numbers anywhere.
Aspect ratio 16:9.
Image made with this prompt
7 more ready-to-use prompts
Different takes on the same topic. Copy any of them as is and replace the parts in square brackets.
1.ChatGPT Gantt task table prompt
When to use: You want the project's tasks, durations and order as a table.
Prepare Gantt chart data for [project, e.g. a cafe website redesign].
- Start
- [e.g. December 1], due: [e.g. January 31].
- Output
- a table with the columns Task, Start, End, Duration (days), Depends on.
Rules
- At most 8 tasks.
- Do not invent dates you do not know; mark them with [?].
2.Mermaid Gantt code prompt
When to use: You want the chart drawn from code with exact dates.
Write Mermaid gantt code for the tasks below.
- Tasks
- [paste the task, start, duration list].
Rules
- Use dateFormat YYYY-MM-DD.
- Group tasks into sections.
- Use 'after' for dependent tasks.
Return only the code block.
3.Gantt data to paste into Excel
When to use: You want to build the schedule as a chart in Excel.
Prepare Gantt data for [project] to paste into Excel.
- Output
- tab-separated columns: Task, Start date, Duration (days).
Then write a short 5-step guide to build a Gantt chart in Excel with a stacked bar chart.
Rules
- Dates in MM/DD/YYYY format.
4.Claude project plan with dependencies
When to use: Your tasks depend on each other and you want to see the risk of delays.
Act as a project planner.
- Project
- [e.g. a store opening].
- Constraints
- [e.g. 6 weeks, a team of 3].
Output
- 1Tasks, durations and dependencies.
- 2The critical path (tasks that move the deadline if late).
- 3A checkpoint for each week.
Ask about anything you do not know at the end.
5.Gantt image with short labels (Gemini)
When to use: You want month names written inside the image.
Create a Gantt chart infographic.
Column headings (spelled exactly like this): "Jan", "Feb", "Mar".
- Rows
- 5 colored task bars stepping down like stairs, icons on the left.
- Style
- flat vector, white background.
Rules
- No text other than these three words.
- Ratio
- 16:9
6.Event planning schedule prompt
When to use: You want to split the preparation for a wedding, opening or conference into weeks.
Build a backward planning schedule for [event, e.g. a store opening party].
- Event date
- [e.g. March 15].
- Output
- a Gantt data table (Task, Start, End) and a day-by-day list for the final week.
Rules
- Vendor approvals finish at least 3 weeks before.
7.Weekly status report image
When to use: You want to show your team which work is done in one image.
Create a Gantt-style image for a weekly status report.
- Layout
- 6 horizontal task bars; done ones solid green, in-progress ones half filled, waiting ones light gray; a dashed vertical line through the middle.
- Style
- flat vector, white background.
Rules
- The image has no text at all.
- Ratio
- 16:9
What this prompt does
Someone searching for a Gantt chart prompt usually wants two things: ChatGPT writing the task list and durations, and a project schedule image to show it. The main prompt creates a Gantt chart image with icon task rows on the left, colored bars stepping down like stairs on the right and a milestone, with every card empty for your task names and dates. The 7 variants below cover a ChatGPT task table, data for Excel, Mermaid code, a Claude plan with dependencies and an image with short labels.
Where to use it
- Project kickoff decks
- Work schedules attached to client proposals
- Event and wedding planning
- Training and workshop slides
- Team boards and weekly status reports
Fields you can fill in
The fields you can change in the form above and their default values.
- Row iconsFree text
- magnifier, sketch sheet, code brackets, browser window, rocket, gear
- Number of tasksOne of 3 options
- 6
- StyleOne of 3 options
- flat-color modern vector infographic
- Bar colorColor
- #3a7d6b
- RatioOne of 3 options
- 16:9
Step by step
- 1
Get the tasks and durations
Use the ChatGPT task table variant and give the project start and due dates. The table lists each task's duration and what it depends on.
- 2
Match the row count to the table
The number of tasks field offers 5, 6 and 8. If your table is longer, group tasks into phases; more than eight rows is hard to read on a slide.
- 3
Generate in Canvas and check the cards
Generate it in Canvas with Use Prompt. Check that the cards are empty and the bars step down like stairs; if made-up text shows up, generate again.
- 4
Add task names and weeks
Bring the image into your slide tool; type task names in the cards on the left and week or month names in the small cards on top. Adjust bar lengths to the real durations if needed.
Tips and variations
- The image is for explaining; track the real project in Excel or a project tool. The Excel variant gives you a table you can paste straight in.
- The dashed line reads as a 'today' line; in a status report, bars to its left count as done.
- To show dependencies, use the Mermaid variant; the code draws arrows between tasks and keeps dates exact.
- For short projects like an event, label the eight columns as days; for longer projects, as months.
Frequently asked questions
Can ChatGPT make a Gantt chart?
ChatGPT writes Gantt data well as a table or as Mermaid code, which a Mermaid viewer turns into a chart. For a presentation-ready image, use the main prompt on this page in Canvas.
How do I write a Gantt chart prompt?
Give the project name, start and end dates, the tasks, each task's duration and dependency, and the output format (table, Mermaid, Excel). Add a line asking it to mark unknown dates with [?].
How do I move a Gantt chart into Excel?
The Excel variant returns tab-separated columns; paste the table into Excel and build a stacked bar chart from the start and duration columns.
Why are the cards in the Gantt image empty?
Image models can get dates and longer text wrong. Generating empty cards and typing the task names later keeps the schedule correct.
What aspect ratio should a Gantt image use?
Rows and columns read horizontally, so 16:9 works best; choose 4:3 or 3:2 for a report page.