10 Infographic Prompts (Gemini): Examples and Guide (2026)
10 ready-to-use infographic prompts for data, how-to steps, comparisons, timelines and product infographics; works in Gemini, ChatGPT, NotebookLM and Entrobase Canvas.
Tested: EntroGen Flash, November 2026
Prompt
Fill in the fields below and the prompt updates instantly. Copy it and use it in any AI tool.
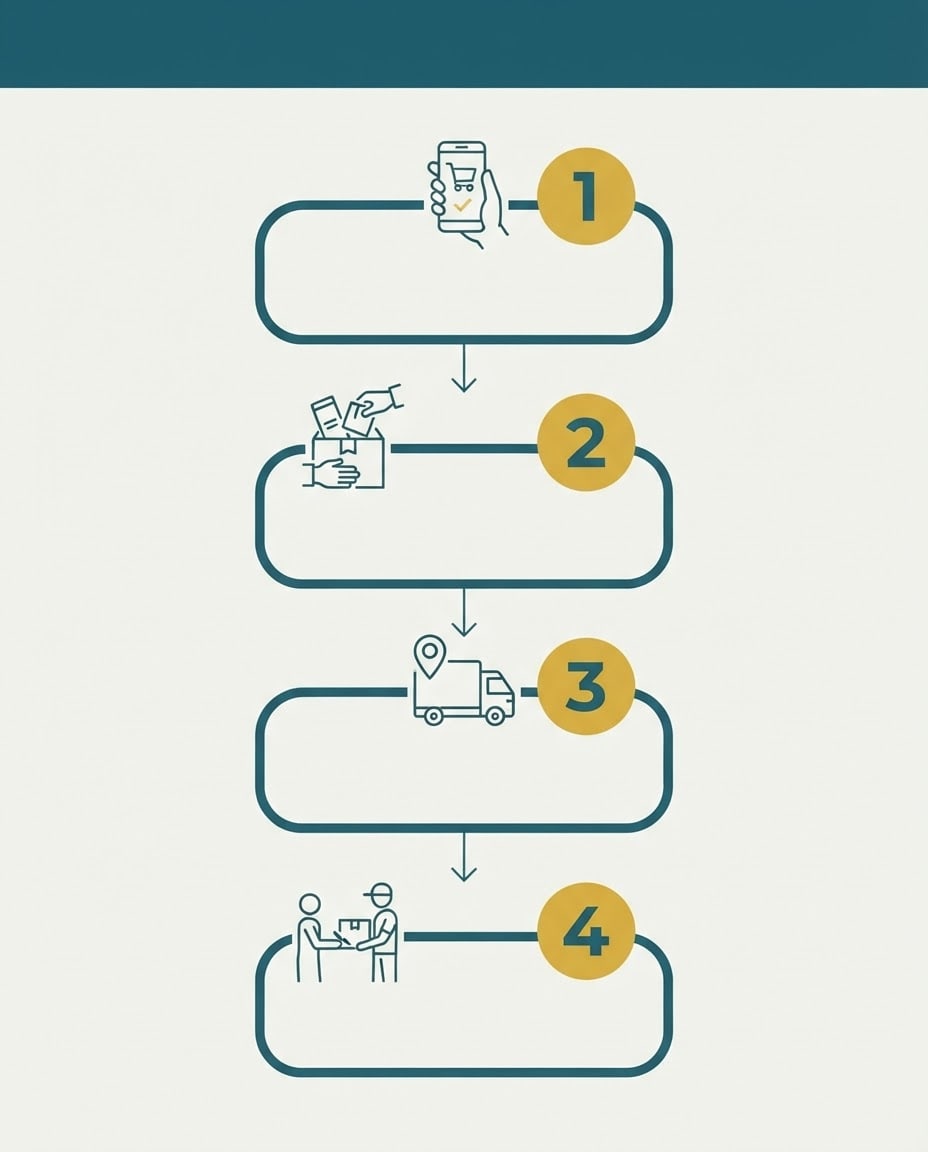
Create a four-section infographic template for text added later.
Topiconline order and delivery process; each section's icon shows one stage.
Layouta top-to-bottom vertical step flow, sections stacked.
Sectionseach has an icon, a circle holding the number 1, 2, 3 or 4, and an empty, rounded flat panel for text; thin arrows show the flow.
Title areaa flat, empty #1f5c6b band across the top.
Styleflat vector illustration, simple color blocks, modern information graphic design.
Light and lookeven, soft light; a plain, untextured off-white background.
Anglestraight-on, flat framing; the whole image is the infographic itself, its off-white background reaching all four edges.
Palettemain color #1f5c6b, off-white background, mustard yellow accent, charcoal icon lines.
Compositionsections evenly spaced and aligned, with wide margins between them and the image edges.
Textthe only text in the image is the numbers 1, 2, 3, 4 in the circles; the band, panels and icons have no letters or words.
Aspect ratio 4:5.
Image made with this prompt
9 more ready-to-use prompts
Different takes on the same topic. Copy any of them as is and replace the parts in square brackets.
1.Nano Banana Pro infographic prompt for data and stats
When to use: You have 3-5 numbers (survey, sales, campaign results) and want a finished infographic with all the text in Gemini.
Design a vertical data infographic using the figures below.
- Title
- "[e.g. 2026 Customer Survey]"
Data
- [e.g. 68% of orders come from mobile]
- [e.g. Average delivery time 2 days]
- [e.g. Return rate 4%]
- Layout
- each figure as a big number with a short caption and a flat icon; percentages as donut charts, durations as bars.
- Style
- flat vector, lots of white space, bold and legible title font.
- Palette
- [e.g. navy, light gray, orange accent]
- Text
- the only text in the image is the text above, spelled exactly the same.
- Aspect ratio
- 4:5
2.ChatGPT infographic prompt for a step-by-step how-to
When to use: You want to explain a process (ordering, setup, application) in 4-6 readable steps; the same prompt also works in Copilot.
Create a step-by-step infographic about [e.g. how to place an online order].
- Title
- "[e.g. Order in 5 Steps]"
Steps
- 1[e.g. Pick a product]
- 2[e.g. Add to cart]
- 3[e.g. Enter your address]
- 4[e.g. Complete payment]
- 5[e.g. Track your parcel]
- Layout
- top-to-bottom flow; each step has a numbered circle, a flat icon and a short label; arrows connect the steps.
- Style
- clean and corporate, white background, [e.g. emerald green] main color.
Rules
- Each step label is 2-4 words, spelled exactly as written.
- No text other than the title and the steps.
- Aspect ratio
- 2:3
3.NotebookLM infographic prompt: one-page summary of your sources
When to use: You want to turn a report, PDF or meeting notes into a one-page summary; customize the Infographic option in Studio and paste this into the description box.
Summarize the [e.g. 5] most important findings from the sources in a one-page infographic.
- Audience
- [e.g. the company's sales team]
- Focus
- [e.g. causes of customer complaints and proposed fixes]
- Layout
- a one-sentence key message at the top, then one card per finding; each card has a short heading, one number and one sentence.
- Style
- minimal, generous white space, two colors at most.
- Text
- short card copy that stays faithful to the sources.
4.Infographic prompt for Claude: editable HTML infographic
When to use: Every word must be exact and you want to edit the text later; Claude writes an HTML infographic that opens in a browser instead of an image.
Write a single-file HTML infographic with the content below; icons as inline SVG, no external links.
- Title
- [e.g. How Your Quote Request Is Handled]
Sections
- 1[e.g. Form: you describe what you need]
- 2[e.g. Review: the team replies within 1 business day]
- 3[e.g. Quote: price and timeline arrive by email]
- 4[e.g. Kickoff: once you approve, the schedule is set]
- Layout
- vertical flow; each section has a number, a simple SVG icon and one sentence.
- Look
- 1080 px wide, [e.g. cream background, dark brown text, orange accent].
- Output
- HTML code only, ready to open in a browser and screenshot.
5.Comparison infographic prompt for two products or plans
When to use: You want to put two options (two plans, old vs new product) side by side feature by feature; works in Gemini and ChatGPT.
Design a side-by-side infographic comparing two options.
- Left column
- "[e.g. Basic Plan]"
- Right column
- "[e.g. Pro Plan]"
Features
- [e.g. Users: 1 / 5]
- [e.g. Storage: 10 GB / 100 GB]
- [e.g. Support: email / live chat]
- Layout
- a thin divider in the middle, a feature icon on each row, values in the two columns; the value that differs is in the accent color.
- Style
- flat vector, rounded cards, [e.g. purple and light gray].
- Text
- the only text in the image is the text above, spelled exactly the same.
- Aspect ratio
- 1:1
6.Timeline infographic prompt for company history or a roadmap
When to use: You want to show your company story, project phases or yearly roadmap with dates.
Design a horizontal timeline infographic.
- Title
- "[e.g. 2027 Roadmap]"
Milestones
- 1[e.g. January: new website]
- 2[e.g. April: mobile app]
- 3[e.g. July: second store]
- 4[e.g. October: international sales]
- Layout
- one left-to-right line; each milestone has a date, a flat icon and a 2-4 word label; milestones evenly spaced.
- Style
- modern, light background, [e.g. teal] line and [e.g. mustard] milestone dots.
- Aspect ratio
- 16:9
7.Product infographic prompt from your own product photo
When to use: You need an e-commerce listing image with 3-4 features pointing at your product; upload the photo to Gemini or ChatGPT, then paste this.
Turn the product photo I uploaded into an e-commerce product infographic; keep the product's shape, color and details exactly as they are.
- Product
- [e.g. stainless steel vacuum flask]
Features
- [e.g. 500 ml]
- [e.g. Leak-proof lid]
- [e.g. Dishwasher safe]
- Layout
- product in the center; each feature linked to the matching spot on the product with a thin arrow, with a small flat icon beside it.
- Background
- plain [e.g. light gray] studio backdrop.
- Text
- short and spelled exactly as above; no text over the product.
- Aspect ratio
- 1:1
8.Sketchnote infographic prompt in a whiteboard style
When to use: You want to share a training, class or meeting recap as a friendly hand-drawn visual note.
Draw a sketchnote-style infographic about [e.g. 5 rules for productive meetings].
Points
- 1[e.g. Share the agenda early]
- 2[e.g. Keep it under 30 minutes]
- 3[e.g. Name one decision owner]
- 4[e.g. Send notes the same day]
- 5[e.g. Phones on silent]
- Look
- black marker lines on a white background, [e.g. orange and blue] highlighter accents, simple doodle icons, arrows and boxed callouts.
- Text
- hand-lettered look but legible, short points.
- Aspect ratio
- 4:3
9.Infographic prompt generator: plan the content with ChatGPT or Claude first
When to use: You are not sure what to write yet; plan the title, sections and layout first, then paste the resulting image prompt into Gemini or ChatGPT.
Act as an information designer planning an infographic.
- Topic
- [e.g. how to compost at home]
Where it will be used: [e.g. Instagram post, 4:5]
- Audience
- [e.g. city dwellers new to gardening]
Output
- 1A title suggestion, 6 words at most
- 24-6 sections, each with a short heading, one sentence and an icon idea
- 3A layout and color suggestion
- 4One image prompt that includes all of the above, ready to paste into Gemini or ChatGPT (with the aspect ratio)
Rules
- Do not invent numbers you cannot verify; if a number is needed, leave a blank and flag it.
What this prompt does
To get a clean infographic from Gemini, ChatGPT or NotebookLM in one go, copy whichever of the 9 variants below fits your content: data, step-by-step process, comparison, timeline, product infographic, sketchnote and an editable HTML version. The main prompt above builds a four-section infographic template for text you add later, with icons, numbered circles and empty text panels ready to fill.
Where to use it
- Instagram explainer post
- Slide and report page
- Process and how-to explainer
- E-commerce product listing
- Training and lesson recap
- Company roadmap
Fields you can fill in
The fields you can change in the form above and their default values.
- TopicFree text
- online order and delivery process
- LayoutOne of 5 options
- a top-to-bottom vertical step flow, sections stacked
- StyleOne of 4 options
- flat vector illustration, simple color blocks
- Main colorColor
- #1f5c6b
- Aspect ratioOne of 5 options
- 4:5
Step by step
- 1
Pick the topic and layout
Type the process the infographic explains in the Topic field (for example, online order and delivery process); the icons are drawn from its stages. The Layout field offers a vertical step flow, a horizontal timeline, a cycle diagram, a 2x2 card grid and a funnel.
- 2
Set the style, color and ratio
Style options are flat vector, isometric 3D, thin line icons and pastel 3D clay. The main color sets the top title band and leads the palette. Choose 4:5 for an Instagram post, 9:16 for a story and 16:9 for a slide.
- 3
Generate in Canvas and check the sections
Open the prompt in Canvas with Use Prompt and generate. You should get four sections, circles numbered 1 to 4 and empty panels; if a panel shows letter-like marks, generate a new image with the same prompt.
- 4
Add the text in your design tool
Put the title in the top band and each stage's short label in its panel. Adding text afterwards keeps spelling and numbers exact, and the same template can carry a whole series of posts.
Tips and variations
- If you want the infographic with all its text in one image, use the Nano Banana Pro variant; in November 2025 Google said Nano Banana Pro renders more accurate, legible text in Slides and builds detailed infographics from a simple prompt.
- When every word must be exact, pick the Claude variant: Claude writes HTML instead of an image, so the text lives in the code, never comes out misspelled and stays editable.
- Keep each section's text to 2-6 words; image models drop letters in long sentences and are far more reliable with short labels.
- Google's model page lists new tall ratios such as 1:4 and 1:8 for Gemini 3.1 Flash Image; try 1:4 to show a long process as a single vertical strip.
Frequently asked questions
How do I make an infographic with Gemini?
Open a new Gemini chat, paste the data infographic variant from this page and fill the bracketed parts with your title and numbers. State the ratio on the last line. According to Google's model page, Gemini 3.1 Flash Image outputs 1K by default and also supports 0.5K, 2K and 4K.
Where do I put an infographic prompt in NotebookLM?
Add your sources (PDFs, notes, web pages) to a notebook, customize the Infographic option in the Studio panel and paste the NotebookLM variant into the description box. Google announced in November 2025 that NotebookLM turns key insights from your sources into infographics with Nano Banana Pro.
Is there a ChatGPT infographic prompt that keeps text readable?
Short titles and 2-4 word step labels usually come out right; long sentences and many numbers raise the error rate. Keep labels short, list every word you want in quotes and add 'no other text'. If the text must be perfect, generate the text-free template with the main prompt or use the Claude HTML variant.
How do I use an infographic prompt template?
The main prompt produces a template for text you add later: four sections, numbered circles, icons and empty panels. Fill the same template with different content in your design tool and a whole post series keeps one consistent look.
Which aspect ratio is best for an infographic?
4:5 is common for Instagram posts, 9:16 for stories, 16:9 for slides and 2:3 for Pinterest. A vertical step flow reads best at 4:5 or 2:3, a horizontal timeline at 16:9.